Origin 2016 Now Available
30/10/2015
Origin 2016 has many new features and improvements. Version 2016 is fully compatible with Windows 10 and Apps have been introduced in Origin and OriginPro. OriginLab can now put standalone features into Apps, so you can decide what features you need to add to your Origin installation. Apps can also be updated independently so fixes and updates can be done quickly.
New features include:
-
Apps to add specific graphing and analysis functionality
-
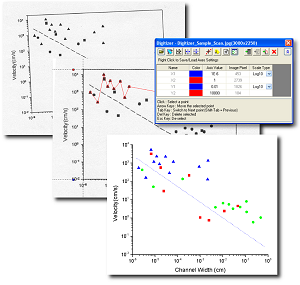
New and powerful Colour Chooser
-
Smart Plotting with Cloneable Templates to quickly create multi-layer graphs with complex mapping of data plots to worksheet columns
-
Batch Analysis by cloning current workbook during multi-file import
-
Professional reports from Batch Analysis using Microsoft® Word templates
-
Dockable Object Manager window to manage layers and data plots in a graph
-
Skip weekends and holidays in financial plots
-
Three-way ANOVA and Partial Correlation in OriginPro
Compare your version to the new features by viewing the reasons to upgrade to version 2016. Also view the full features list.
View the differences between Origin and OriginPro here.
Origin 2015 Now Available
28/10/2014
Origin 2015 provides more than 100 new features and improvements. It adds better useability to perform and manage complex data analysis and provides new and improved graphing capabilities to produce publication-quality graphs tailored to your specifications.
New features include:
-
New Graph Types – Column Scatter, Heat Map, Kernal Density Plot
-
Distribution Fit, t-tests on Rows, RMANOVA with unbalanced Data
-
Batch Plotting in 3D and Contour graphs
-
Collapsible menu, Append Worksheets either by column or row
-
Graph Preview, Tool tip, Extra Large Icons and Search functionality in Project Explorer
-
User-Defined Order for Categorical Data used for Graphing and Analysis
-
SPSS File Import
-
Python Support in Programming
Origin 9.1 Now Available
22/10/2013
Origin 9.1 is now available. There has been over 200 new features and improvements added to version.
Key New and Improved Features in Origin and OriginPro 9.1 are:
-
Grouped Box Charts, Grouped Column/Bar Plots
-
Column/Bar: Variable Width, 100% Stacked
-
3D Waterfall, 3D Ternary Surface
-
Piper/Trilinear Diagram, Marginal Histogram/Box Chart
-
Improved Polar Plot
-
Multiple Axis Breaks, User Defined Axis Scale, Multiple Special Tick Labels
-
Smart Labeling - Auto Positioning of Data Labels
-
Batch Plotting
-
Worksheet Column Label for Formula, Set Multiple Column Values
-
Batch Analysis using Gadgets
-
Copy and Paste Analysis Operations
-
Partial Least Square Regression
-
Akima Spline Interpolation, LOWESS and LOESS Smoothing
Origin 9 Released
02/11/2012
Origin 9 provides the flexibility and robust functionality to manage complex data analysis and graphing tasks by performing statistics, curve fitting, peak analysis, data management, signal processing and image analysis.
For example, it is designed for users at varying technical levels to create and customise publication-quality 2D, 3D and contour graphs using a point-and-click interface. View Origin 9 Graph Gallery.
OriginPro 9 offers all of the features of Origin plus extended analysis tools. OriginPro is the complete software package for those who want a single data analysis, statistical and graphing solution. View the comparison chart for Origin and OriginPro or download a free 21 day trial.
New features include:
-
High-performance 3D Graphing, 3D Function plots and 3D Parametric plots using OpenGL
-
3D Parametric Function Plots using parametric equations
-
Movie/Animation Creation
-
Floating Graphs in Worksheets and Global Vertical Cursor
-
Implicit Function Fitting (Pro Only)
Origin 8.6 - reviewed in Desktop Engineering
27/04/2012
Origin, the base version, and OriginPro, with extended functionality, provide control over every visual and contextual parameter of a plot.
Since our last review of Origin and OriginPro from OriginLab Corp., Northampton, MA, in July 2011, their developers have been hard at work to improve the processing power and level of insight offered by large amounts of critical data.
Version 8.6 of the data analysis and graphing software was released in November 2011, and shows that Origin fans won’t be disappointed. As OriginLab founder Dr. CP Yang states, “We are committed to developing a product portfolio that caters specifically to the needs of our users.”
For engineers, scientists and researchers who still rely on Microsoft Excel for plotting and data analysis, the ability to extract insight from data offered by Origin will hit you like a shot of triple espresso. You won’t look back. Anyone who works with large datasets knows that the more ways you can visualize data will help in identifying non-intuitive trends and correlations. Origin has truly set the bar for plot types and richness of graphics.
One of the most notable improvements in version 8.6 is the implementation of a native 64-bit version. Users of large datasets have already noticed the increased speed of data manipulation and analysis. Additionally, the 2GB file size restriction of the 32-bit version is removed, allowing users to leverage the installed RAM on their PC to its fullest.
The User Interface
As shown in Figure 1, Origin is toolbar-driven with two primary sections: the Project Explorer, on the left, and the working or active window. In version 8.6, the Project Explorer is now dockable so that with a single click, that extra space is returned to either a table or graph view in the workspace. Other dockable windows include a new Message Log Window and Quick Help, previously accessible from the View dropdown menu.
Figure 1: The Origin 8.6 user interface.
Other interface improvements in Origin 8.6 that regular users will welcome are additional pan and zoom options that clearly acknowledge some people are mouse-centric and others are keyboard-centric. By using the Control key, one can zoom in and out with either the mouse wheel or keystrokes. Similarly, the Control and Shift keys give access to vertical and horizontal panning.
by Vince Adams Published April 1, 2012. Vince Adams is currently an account manager for LMS, is a longtime simulation educator, consultant and speaker. He has authored three books on finite element analysis and numerous magazine articles.
To view full article, please click here.
To view more information on Origin and OriginPro, please click here.
Origin 8.6 Released
16/11/2011
New version includes Native 64-bit Application, Advanced Statistics, New Gadgets, and Other Improvements based on customer feedback
OriginPro 8.5.1 - A New Point of Origin
29/07/2011
In the data-driven worlds of research and engineering, more truly is better. OriginPro 8.5.1, released in April, “provides tools for serious data analysis, such as Peak Fitting, Surface Fitting, Statistics, Signal Processing, and Image Handling,” says Joe Przechocki, business development manager of OriginLab Corp., Northampton, MA.
Origin began in the early 1990s as a utility for processing data from microcalorimeters from MicroCal Corp. (now part of GE Healthcare). Its beginnings focused the product on publication-quality graphing and easy-to-use curve-fitting for Windows users. MicroCal quickly recognized its value and flexibility early on, and a new company called MicroCal Software was developed for the sole purpose of developing Origin for wider applications. In 2000, the company changed its name to be more in line with its popular product name. OriginLab Corp. was born.
In a nutshell, Origin, the base version, and OriginPro, with extended functionality, provide point-and-click control over every element of a plot. Additionally, users can create multiple types of richly formatted plots, perform data analysis and then embed both graphs and results into dynamically updated report templates for efficient re-use of effort.
“At a conference, you can tell right away who’s using a graphics program like OriginPro and who’s not,” notes Jeff Thompson, a research scientist at the Energy & Environmental Research Center in Fargo, ND. He frequently acquires data in relatively short-duration projects that needs to be analyzed, then published or presented. The “polish” and personalization he can add to a report drew him to Origin Pro, he says.
All data, plot types and settings are saved in a single project file (called an OPJ file), so organizing, archiving and sharing is practically painless. Furthermore, OriginLab offers a free Origin Project Reader so that any colleague "or customer "can access OriginPro data without a copy of the software installed.
See the full article at http://www.deskeng.com/articles/aabbka.htm.
Vince Adams, currently an account manager for LMS, is a longtime simulation educator, consultant and speaker. He has authored three books on finite element analysis and numerous magazine articles.
Origin 8.5.1 Released
06/05/2011
OriginLab Corporation recently released the latest version of Origin and OriginPro 8.5.1. This version is available to all Maintenance customers. New Gadgets, improved graphing capabilities and worksheets are among the new features.
OriginPro 8.1
17/05/2010
Origin and Origin Pro 8.1 are probably the current holders for the most accessible and user friendly (graphical) tool on the market… it is the inclusion of “gadgets” in this latest service release that pulls everything together in a decisive leap forward.
The extension of proper data analysis and visualisation to the generic desktop, putting it on the same omnipresent footing as standard office applications like word processor, email and spreadsheet, is a holy grail. With service release 2, Origin and OriginPro 8.1 are probably the current holders for most accessible and user friendly tool on the market. The approachability agenda has been obvious in Origin's development curve for some time, became especially clear with version 8, and sharpened up further with release 8.1, but it is the inclusion of 'gadgets' in this latest service release that pulls everything together in a decisive leap forward.
The two products are differentiated by absence or availability of particular tool sets, but otherwise have much in common. I'll treat them together here, referring to both as 'Origin' and simply noting when a feature is available only in the 'Pro' version.
Automation, personalisation and reuse are central to Origin workflow. Analyses (as simple as a single plot, or as complex as a multipage report exploring every aspect of a data set) that have once been set up can be saved as templates, with the data stripped out and ready for repopulation. Batch processing allows the same analyses to be applied across multiple data sets (which can be selected on the fly by familiar point, click and drag gestures). Browser style shortcuts to particular Origin components can be saved in any convenient Origin Project Explorer folder, including the new favourites folder for quickly accumulating collection of links in one place. I've hawked my review copy around a range of guineapig groups, from statistically experienced postgraduates to primary school classrooms, and using the favourites folder as a scratchpad for assembly of materials during exploration has been a recurring theme in all of them. Menus are soft, reconfigurable to reflect the user's working priorities.
Gadgets sit on top of this workflow. There are five of them so far (curve integration, FFT, rise time, descriptive statistics and quick fitting), with more presumably to follow in subsequent service releases or upgrades. Each of them is applied to a currently active graph, and allows a region of interest (RoI) to be drawn using click and drag across the displayed data points. Once the RoI has be drawn, it can be moved and resized using handles and results instantly reflect the changes.
In a particularly impressive live trial, a history student with no previous data analysis software experience explored a physical sciences data set with a well accepted third order polynomial model. By using the quick fit gadget RoI as a trial and improvement tool he found that a better fit was obtained by using six separate straight lines. Working backwards from that discovery, using the RoI again with the descriptive gadget as an intermediate stepping stone, he uncovered important new information from primary documents whose significance had previously been overlooked.
Origin has always had a document oriented structure, enabling near DTP reporting, but also now offers an inboard slide show presentation option. For purely data analytic and visualisation purposes this trespasses heavily on the territory occupied by generic presentation software, but there is also a very useful provision for exporting output to Microsoft PowerPoint for use within a conventional office environment.
After all this usability enthusiasm, what of the core function front? There are extensions to the graph types supported, to the ease with which multiple axes are used, and user controlled interfacing with LabTalk. Data reduction and rearrangement tools are provided (to a useful extent in Origin, considerably more so in OriginPro) as are (in OriginPro only) filtered signal decimation, batch analysis of peaks using Origin 'themes', signal envelopes and rise/fall time analyses. Another interesting and unusual option (again in OriginPro only) is the area of surfaces fitted to three dimensional XYZ data.
Team project administration gains a detailed audit log and passworded access which, though not likely to excite the individual user, is a big gain for team working in any serious institutional or corporate environment.
Reviewed by Felix Grant, Scientific Computing World.
Origin and OriginPro Site License - Special Discount valid until 30th June 2010
16/04/2010
To allow Origin and OriginPro to be more accessible in your organisation, Hearne is offering 15% discount for any new Site licences (minimum of 6 users).
Origin software is the complete graphing and data analysis software package for researchers, scientists and engineers. Origin and OriginPro have been widely used by the world’s leading research organisations and universities such as NASA, U.S. Naval Research Laboratory and Harvard University. The software is also widely used by Australia’s premier Universities and research groups, such as, CSIRO, ANSTO and DSTO.
To allow Origin and OriginPro to be more accessible in your organisation, Hearne is offering 15% discount for any new Site licences (minimum of 6 users). Special upgrade prices are also available if your organisation already has a multi-user licence of Origin/Pro or another graphing/data-analysis software and you wish to upgrade to the latest version of Origin/Pro or increase the number of users. Please contact us for a quote. This offer is valid until the 30th June 2010.
“Origin 8 is a significant advancement of the series, improving upon the usability and stability of previous incarnations. Improvements in the workbook portion of the program are especially impressive, making Origin the top application for data management, analysis, and graphical presentation.”
- R. Alan May and Keith J. Stevenson
University of Texas at Austin
“Origin has become the de facto standard for archiving and analysis of experimental data in the field of condensed matter physics.”
- C.M. Roland - U.S. Naval Research Laboratory
“Origin has always been one of the most powerful packages for data analysis and graphing. With the new multi-sheet workbook's full formatting features and its ability to embed both images and graphs, OriginLab is moving a big step forward. From raw data to final professional report creation, you can now keep all the stages of data processing in a single software.”
- Antoine Couturier, Ph.D
Institut National du Sport et de l'Education Physique
“I have been using Origin since 1991, and have found it to be the fastest and most efficient tool for creating graphics. The new version of OriginPro 8 adds additional statistical features that are extremely useful, as well as the ability to add Sparklines that allows me to see trends in data before formal graphs are made. This allows me to pick only the most important parameters to plot without getting bogged down in making many plots that I won't use in a final publication. In addition, the ability to have units and comments in the data sheets makes plotting much simpler.”
- Dr. Michael Rosen - U.S. Geological Survey
To view the full list of new features in version 8.1, please refer to our website.
New Origin version 8.0
22/10/2007

Origin 8.0 introduces a new multi-sheet workbook to facilitate the management of data, images, graphs and results.
The new Origin 8 offers a completely new workbook that forms the centrepiece of the Origin workspace. With the multi-sheet workbook, Origin users can efficiently organise and manage data, analysis reports, graphs and images using an intuitive and flexible interface.
You can learn about Origin 8 software at a free live web seminar on November 27 at 2pm Australian Eastern Daylight Savings Time or 4pm New Zealand Daylight Savings Time.
“For Origin 8, we have nearly revamped the entire application, making significant improvements in how data, graphs and analysis results are created, explored and organised. Just for starters, our implementation of Edward Tufte’s sparklines in our new workbooks will allow users to quickly and easily get a feel for their worksheet data. It can be said that this new version defines a new product category – one that offers the best of many worlds and seamlessly integrates it all: the familiarity and versatility of workbooks, publication-quality graphics, high-end data analysis and straightforward algorithm development.” - OriginLab’s founder and President, Dr. C.P. Yang.
Multi-sheet workbooks now provide a handy way to keep related data, analysis results and graphs together. Furthermore, users can create attractive reports using worksheet customisation such as rich text cell formatting and cell borders. To provide full control over workbook content, sheets can be moved, added, inserted or deleted. As a special capability, Origin’s workbooks can contain graphs and images within cells – allowing for workbooks as an organisational container, or to aid image processing.
New in Origin 8, analysis results can be automatically placed into a worksheet within the raw data's workbook. In this way, parameter values, statistics and related analysis graphs are just a click away whenever looking at the original data. This new concept provides much better organisation and more detailed reports compared to previous versions. As an added convenience, results of any previous analysis operation may be updated if the source data or analysis parameters are changed. To take advantage of both result consolidation and recalculation, users can set up an analysis operation as desired, with customised dialog settings, then save the workbook or even an entire Origin project as a template. Later, future analysis of the same type of data may be quickly performed by simply replacing the original data.
Just as Origin places graphs within result worksheet cells, users can place their own graphs in worksheet cells to create a custom report. An embedded graph may be modified for publication or presentation at any time simply by double-clicking on it to launch a graph window. After the graph has been customised, and the graph window is closed, updates are saved to the embedded graph contained in the worksheet cell.
Origin offers special embedded graphs, called sparklines, within worksheet column headers. Column sparklines provide small profiles of the column’s data, which allows the user to quickly view the profile of the data in ways that have not been possible in past versions or any products within Origin's marketplace. To further permit one to see trends within data, the aspect ratio of column sparklines can be easily changed by changing the column width and/or row height. Origin also allows any graph to be copied to the clipboard as a sparkline so that a small, word-sized graphic may be used within text documents.
Origin 8 significantly builds upon OriginLab’s tradition of providing the required blend of tools to accommodate both the novice and advanced users.
The new multi-sheet workbooks with rich text formatting makes it easy to consolidate and manage imported data, images, database query results, analysis reports and publication-quality graphs.
With addition of its new workbook and expanded data analysis capabilities, Origin has evolved from a popular graphing software to become a full-fledged data analysis and graphing workspace.